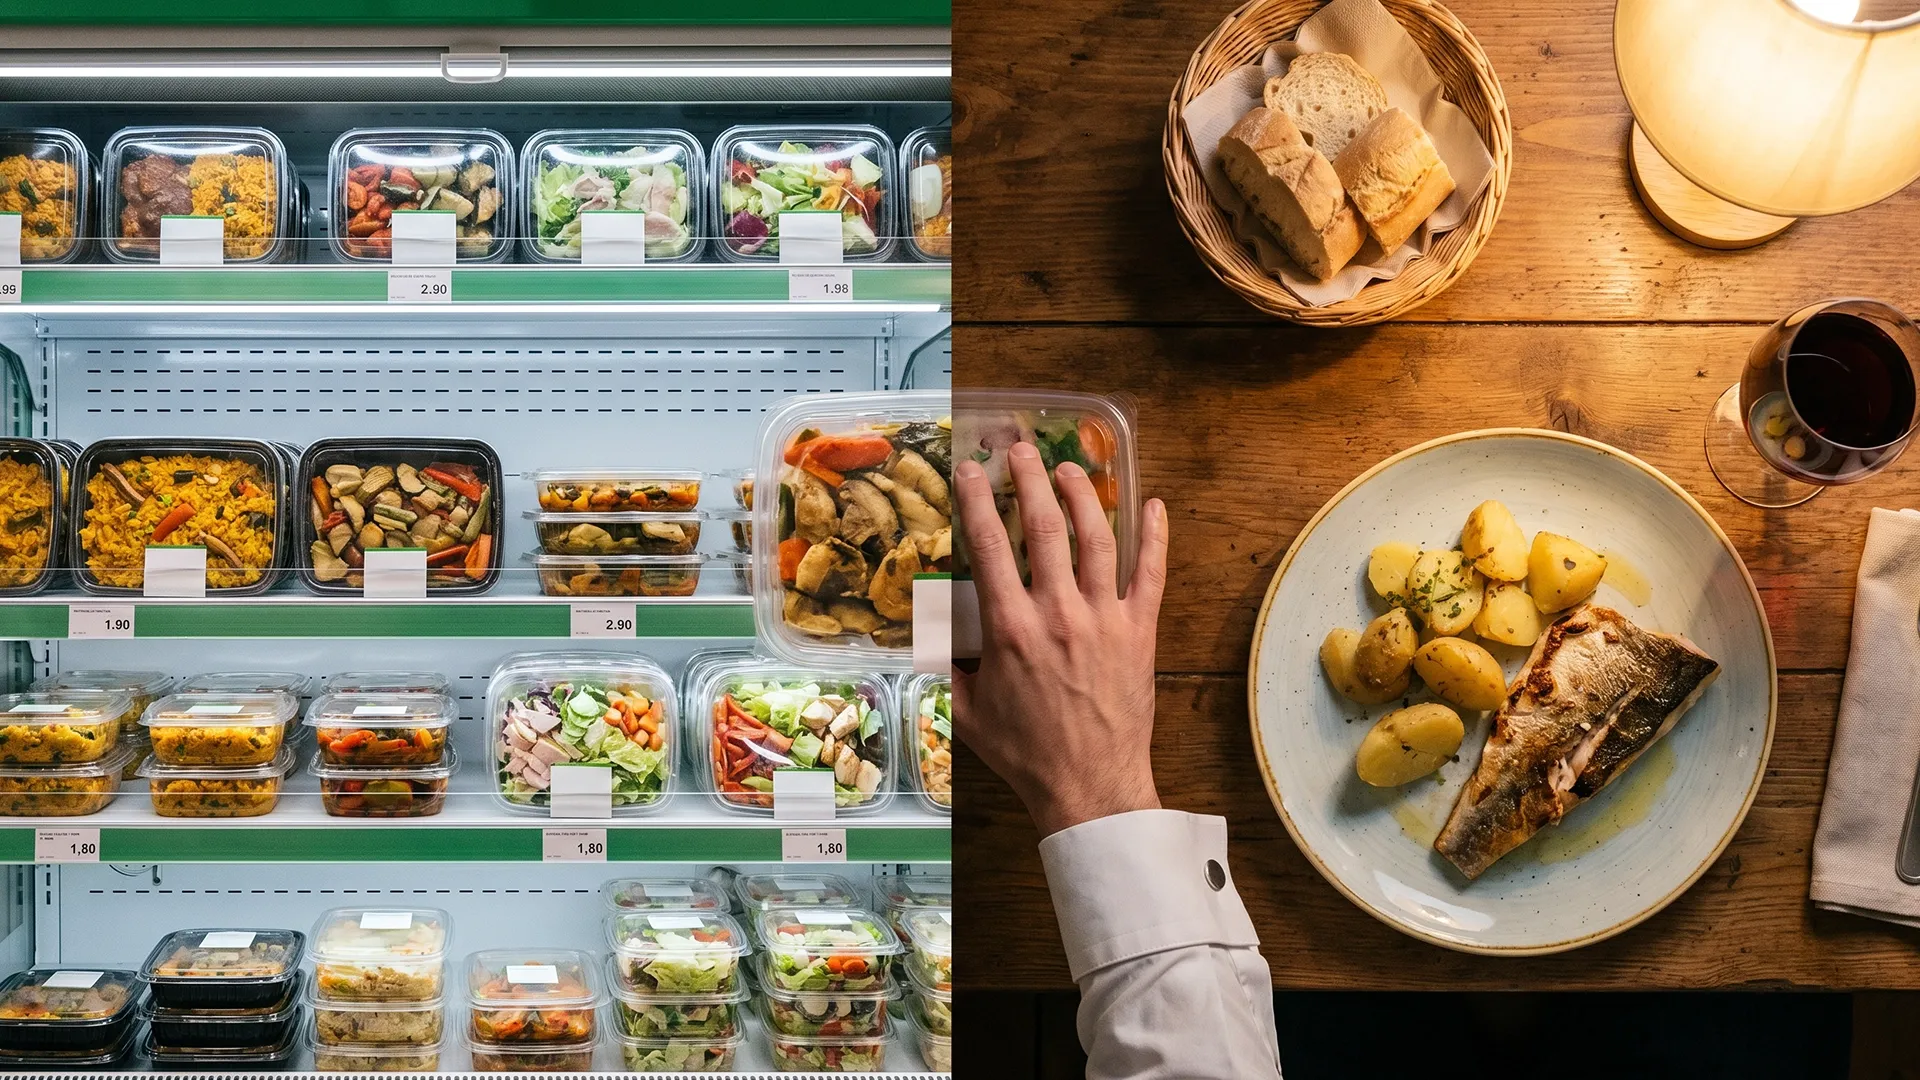
In the restaurant industry there are two forms of sales: fixed price (tasting menu, daily menu) and open price (à la carte).
The difference between both is evident: In the fixed price model, the retail price is already defined, so revenues and consequently profit margins are "always" the same. We know that costs fluctuate, so a recipe cost tool like Prezo helps us keep our recipe costs updated. From here, the strategy we must implement is called cost grouping. A tool widely used in the events industry or ice cream shops.
What is Cost Grouping and How to Use It?
Cost grouping is a strategy used mainly in businesses that sell products at the same price, such as ice cream shops or catering services. For example, in an ice cream shop, all flavors have the same price, regardless of the cost each one represents.
This model is replicated in closed menus. When a daily menu or wedding menu is offered, multiple options (appetizers, main courses, etc.) are presented, but the customer only selects some. Key questions arise here:
- When should I create a second, more expensive daily menu?
- Which dishes should have a supplement?
- How many appetizers should the customer be able to choose?
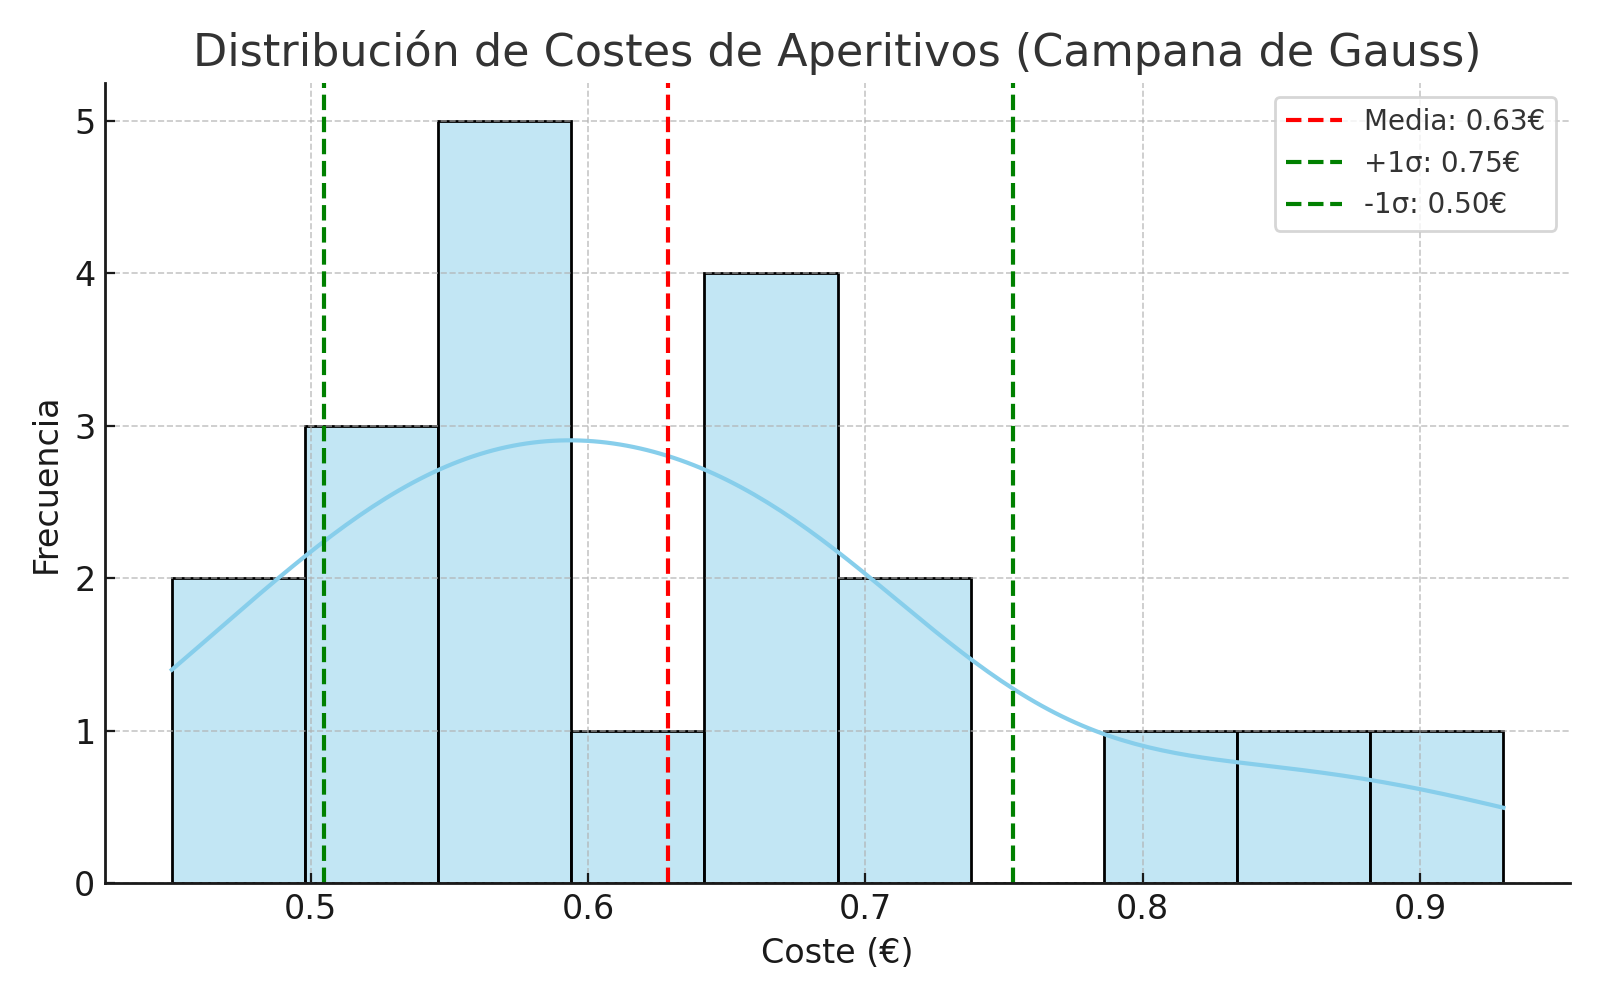
Cost grouping allows us to answer these questions by analyzing the cost of each dish and classifying them according to their financial impact. This classification follows a distribution similar to a bell curve, helping us identify which ones deviate significantly from the average cost.
Real Example
Suppose the company Bodas SL offers 20 appetizers, of which the customer can choose 13. Depending on the selection, the final cost can vary considerably, which represents a challenge for the sales team.
This is where cost grouping comes into play: prices are analyzed and appetizers are grouped into two categories.

If we offer our customer all 20 of these appetizers, it can mean 2 scenarios:
- They choose the 13 cheapest: €7.25
- They choose the 13 most expensive: €9
This represents a difference of €1.75, a risk we leave to chance. If we apply the bell curve in this example, it will offer us to give the same product offering, but restructuring it.

Now with the new distribution, we can offer the choice of 12 appetizers from category 1 and 1 appetizer from category 2.
- They choose the 13 cheapest (12 category A + 1 category B): €7.42
- They choose the 13 most expensive (12 category A + 1 category B): €8.46
In this way we have guided our customer to select appetizers differently and consequently have greater cash management and margin prediction.
Economic Impact
Let's see it with numbers.
- In the first example our customer could reach a cost of €9/person
- In the second example our customer could reach a cost of €8.46/person
This makes a difference of €0.54, if this 2024 we fed 30,000 people with just the new dish offering structure we could save €16,200. A clear example of how simply restructuring the offer we can have greater control of our costs and better plan for the future.