A restaurant KPI is a numerical indicator that turns what happens in your business (sales, purchasing, kitchen, team) into a figure you can compare month by month and use to make decisions. A good restaurant KPI is not there to fill a report: it is there to spot where your margin is leaking before it shows up in the profit and loss account.
In this guide we go through the restaurant KPIs that help most to control profitability and operations. For each one you will see what it measures, how it is calculated and what data you need for the figure to be reliable.
What a KPI is in a restaurant
KPI stands for Key Performance Indicator. In hospitality, a KPI is a metric that answers a specific business question: how much do I earn for every euro I sell? How much product do I buy and how much ends up on the plate? How much does the team cost me per service?
It is worth distinguishing between a data point and an indicator. This month's sales are a data point. This month's sales compared with last month, with the cost of what was consumed and with the hours worked are an indicator. A KPI always puts the data in relation to something.
Why it is important to measure your business indicators
A restaurant can fill every service and still lose money. Restaurant indicators let you see that difference, and they do so for three reasons:
- They separate impression from reality. "We've been really busy this month" says nothing about the margin.
- They locate the problem. If profit falls, a single KPI will not tell you why, but the set of them will: it may be a rise in purchase prices, waste that is not being recorded or a badly adjusted rota.
- They let you compare. Without indicators there is no way of knowing whether a decision (changing a dish, renegotiating with a supplier, moving shifts) has worked.
A word of warning: the figure is only as good as the source data. If purchases are recorded by hand and late, your food cost will come out wrong however well you apply the formula.
Sales and revenue KPIs
These are the basis on which almost everything else is calculated. Always work with net sales, excluding VAT.
Total sales per period. These come from the POS. Compare them with the same period last year, not just with the previous month, because seasonality distorts the reading.
Average ticket. Net sales ÷ number of tickets. For example, €60,000 across 3,200 tickets gives an average ticket of €18.75. It tells you whether customers are spending more or less, but not whether that sale leaves a margin: that is why it has to be read alongside the rest.
Sales by service, time slot or category. Separating food, drink and other income, or lunches from dinners, shows you where your turnover really comes from.
Sales per hour worked. Net sales ÷ hours worked by the team. With €60,000 and 1,500 hours, that is €40 per hour. It links revenue with staff, and we come back to it below.
Profitability and margin KPIs
This is where the underlying question gets answered: how much is left after paying what it costs to sell.
Gross margin. (Sales − cost of raw materials consumed) ÷ sales. If you sell €60,000 and have consumed €19,800 of product, your gross margin is 67%.
Prime cost. Cost of raw materials consumed + staff cost, divided by sales. With the same figures and €18,600 in staff costs, it comes to 64%. It is useful because it groups together the two costs that weigh most and that you can act on most.
Margin by category or by dish. An acceptable overall margin can hide families of products that drag the result down. Analysing by category lets you see which ones hold the business up and which ones erode it.
Evolution over time. The value of a KPI lies in its trend. A margin that drops two points in three months deserves a review even if it is still "at a good level".
To calculate them you need to cross-reference three sources: POS sales, recorded purchases and actual consumption. That is usually where the analysis breaks down when the data lives in different places.
Purchasing and food cost KPIs
Food cost. Cost of raw materials consumed ÷ net sales. For actual consumption, use this formula: opening inventory + purchases − closing inventory. With €6,200 opening, €19,600 in purchases and €6,000 closing, consumption is €19,800 and food cost is 33%.
Theoretical versus actual food cost. The theoretical figure comes from your cost sheets: what the dishes sold should have cost. The actual figure comes from what has been consumed. The difference is pure information. If your theoretical food cost is 30% and the actual one is 33%, three points are being lost to waste, portioning, receiving errors or unrecorded consumption. On €60,000 of sales, that is €1,800 in a month.
Purchase price variation. Compare the latest price of each product with its average price. Suppliers rarely announce a small increase, but the cumulative effect on your cost sheet margin is real.
Each supplier's share of spending. Seeing how much you concentrate with each one helps you negotiate and spot dependencies.
For your actual food cost to be reliable, delivery notes and invoices need to be recorded properly and stock needs to be counted with consistent criteria.
Inventory and waste KPIs
Inventory turnover. Consumption for the period ÷ average inventory value. With consumption of €19,800 and an average inventory of €6,100, stock turns over about 3.2 times a month.
Days of stock. Closing inventory ÷ daily consumption. With €6,000 of stock and consumption of €660 a day, you have just over 9 days of product in storage. Too much stock ties up cash and increases the risk of products expiring; too little leads to stock-outs.
Yield and waste. Yield is the percentage of product you actually use. If you buy 10 kg and are left with 8 kg, your yield is 80% and your waste is 20%. Be careful when a product goes through several stages: yields are multiplied, not added. An ingredient with an 88% yield after cleaning and a 55% yield after cooking ends up at 48.4% (0.88 × 0.55), not 43%. You can go deeper into how to calculate them in our guide to food waste in restaurants.
Waste by cause. Separating "natural" waste (cleaning, cooking) from management waste (expiry, production errors, returns) tells you which one you can reduce.
Staff and labour cost KPIs
Labour cost as a share of sales. Total staff cost ÷ net sales. With €18,600 and €60,000 in sales, that is 31%. It includes wages, social security contributions and any other cost associated with the team.
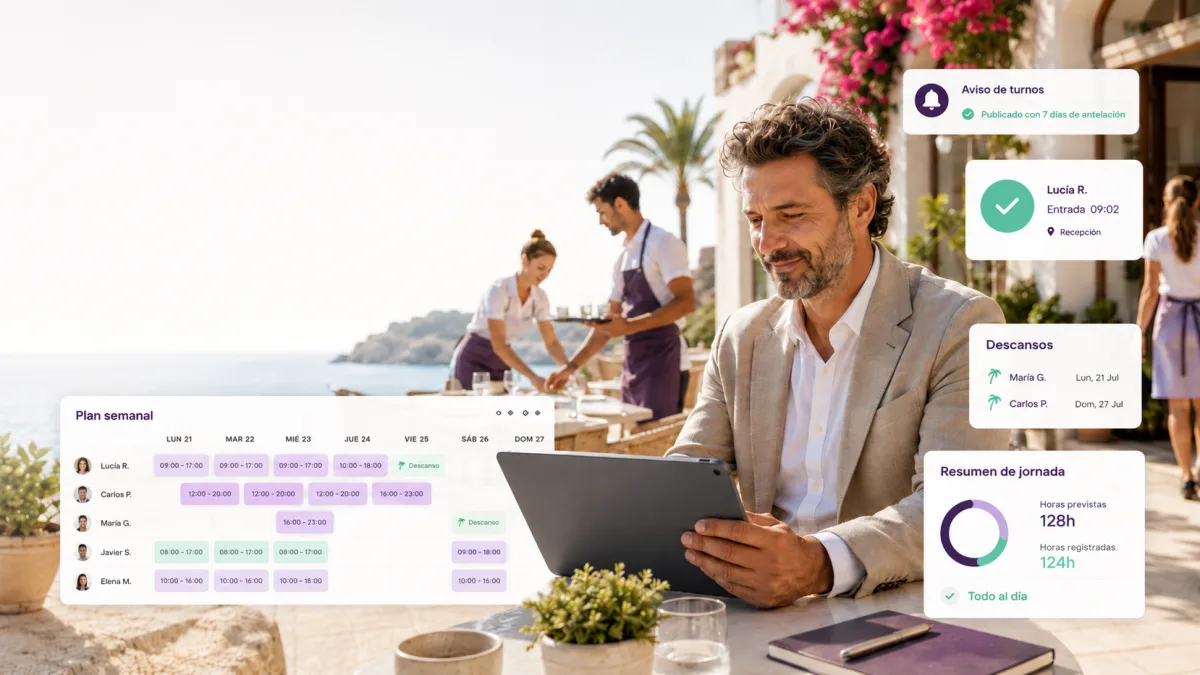
Hours worked and overtime. Comparing what was planned with what was actually clocked shows you where the rota drifts.
Absenteeism and punctuality. Absences and lateness have an operational cost that rarely shows up in the accounts until it builds up.
Sales per hour worked. This is the simplest productivity indicator: if labour cost rises but so do sales per hour, you may be sizing the team correctly; if cost rises and sales per hour fall, some service is overstaffed.
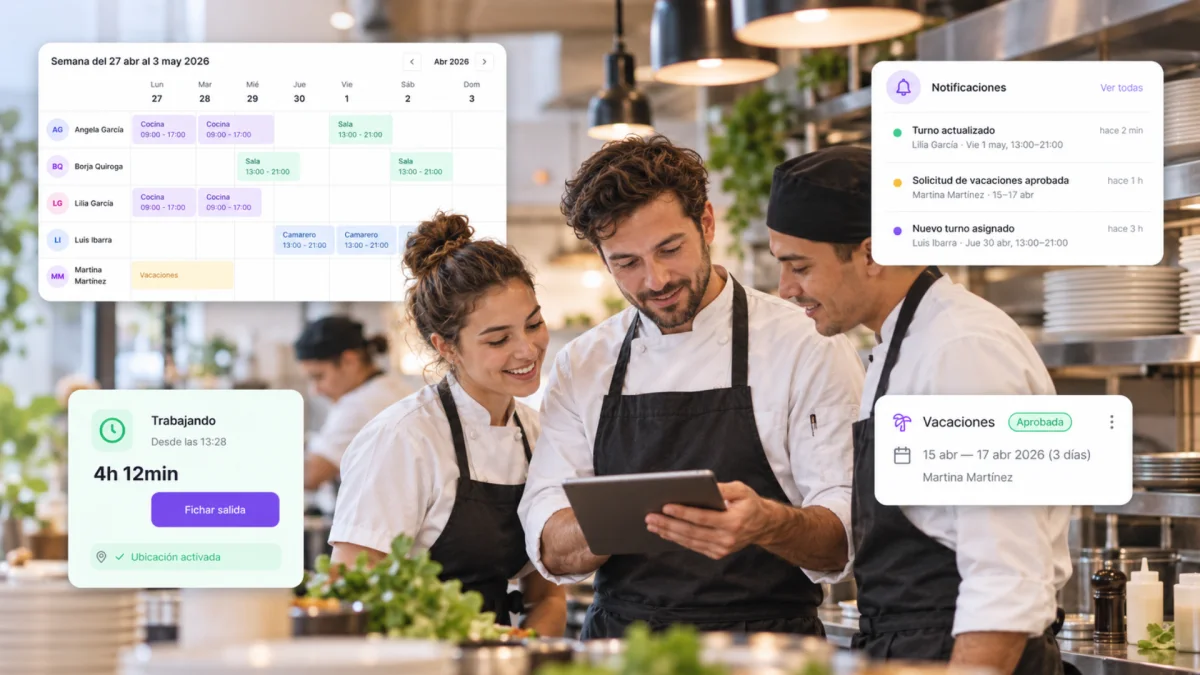
To measure all this you need recorded hours and the cost associated with each employee in one place. With Prezo reports and analytics you can compare planned and recorded hours, and see additional hours, absenteeism, punctuality and labour cost.
How often KPIs should be reviewed
Not all of them are checked at the same pace. A practical reference:
| Frequency | What to review |
|---|---|
| Daily | Sales and average ticket |
| Weekly | Labour cost, overtime, purchase price variation, waste |
| Monthly | Actual versus theoretical food cost, margin, prime cost, turnover and days of stock |
| Quarterly | Trends by category, supplier share, review of cost sheets and menu prices |
What matters is that the review is regular and uses the same calculation criteria. A KPI that is calculated differently every month is useless for comparison.
How to centralise your indicators to make better decisions
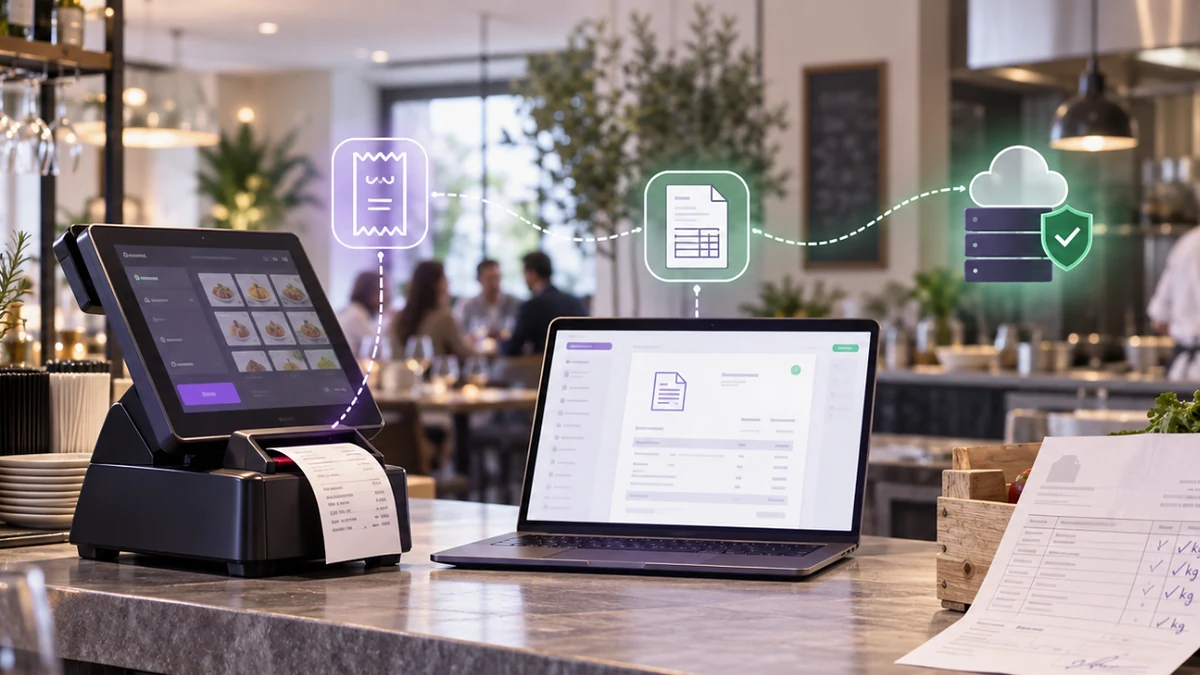
The usual problem is not a lack of indicators but that the data is scattered: sales in the POS, purchases in paper invoices or in email, inventory in a spreadsheet, hours in another system. Every time you need to cross-reference them, time is lost and errors creep in.
Centralising means three things:
- Recording information once, at source: delivery notes, invoices, stock counts and clock-ins.
- Using a single definition for each KPI (for example, what goes into "staff cost").
- Looking at the indicators together, so that a deviation in food cost can be explained by what has happened in purchasing, stock or the kitchen.
Scattered data is no use for making decisions. What helps is having purchasing, stock, kitchen, staff and sales connected.
How Prezo helps you analyse profitability and operations
At Prezo we connect purchasing, inventory, cost sheets, staff and sales, so that your indicators come from data that is already recorded and not from spreadsheets that have to be put together every month.
The Prezo profitability report brings together the sales from your POS with your recorded costs and expenses so you can compare revenue, costs and margin, analyse food cost and cost as a share of sales, see which categories are most profitable and compare how things evolve between periods. And with the staff reports you can close the loop on labour cost.
If you want to see what your indicators would look like with your own data, request a demo.
Frequently asked questions about restaurant KPIs
What are the most important KPIs for a restaurant?
The ones that directly affect your margin: food cost, staff cost, prime cost, gross margin, average ticket and waste. From there you can add inventory turnover or sales per hour worked, depending on what you need to control.
How is a restaurant's food cost calculated?
By dividing the cost of the raw materials consumed by net sales. Actual consumption is calculated as opening inventory plus purchases minus closing inventory.
How often should a restaurant review its indicators?
Sales, daily; staff, purchasing and waste, weekly; actual food cost, margin and stock, monthly. Trends by category and supplier, quarterly.
What do I need to calculate my restaurant KPIs properly?
POS sales, recorded purchases and invoices, regular stock counts, up-to-date cost sheets, and staff hours and costs. If any of them fails, the indicator will not be reliable.